FARBench: How Far Are LLM Agents from Autonomous Research?
Can LLM agents move beyond assisting researchers to autonomously make progress on frontier problems? FARBench evaluates the end-to-end research loop — explore, code, run, and iterate from an empty workspace — across 29 tasks in 5 domains.
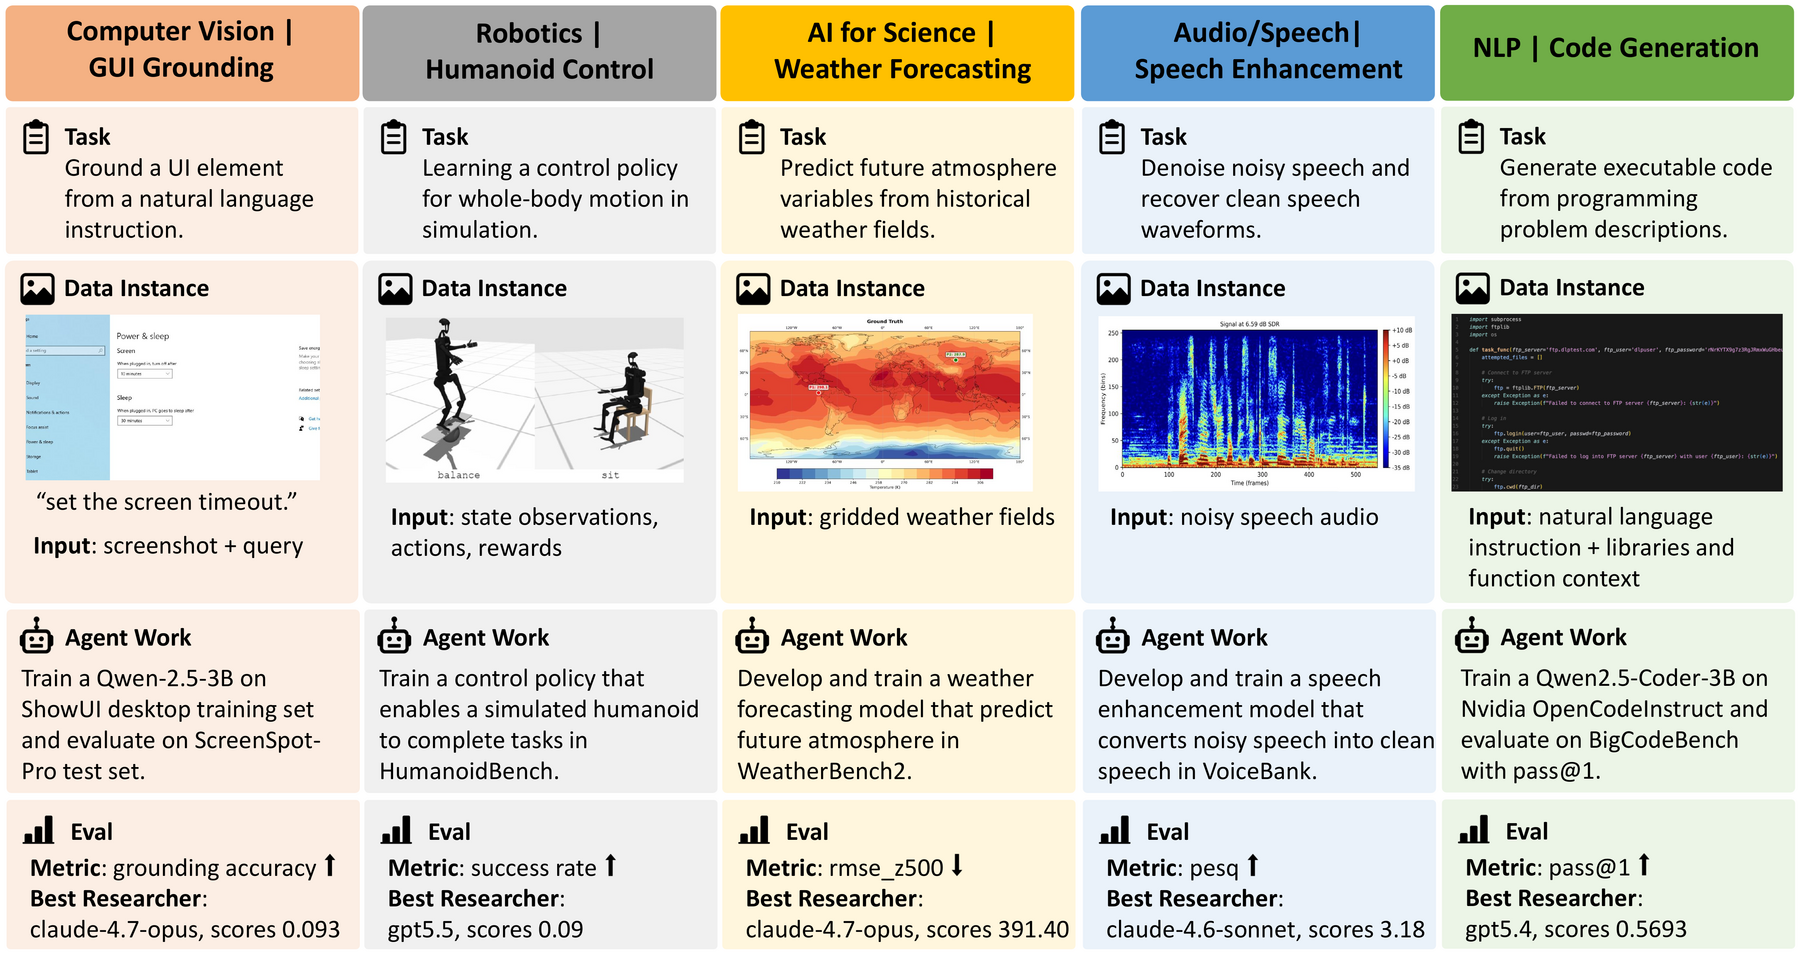
At each step the agent reads an observation (task spec, files, code, command output, metrics), writes an action (edit files, run a command, submit for evaluation), and the sandbox returns results that feed the next step — a closed empirical loop under a fixed budget.
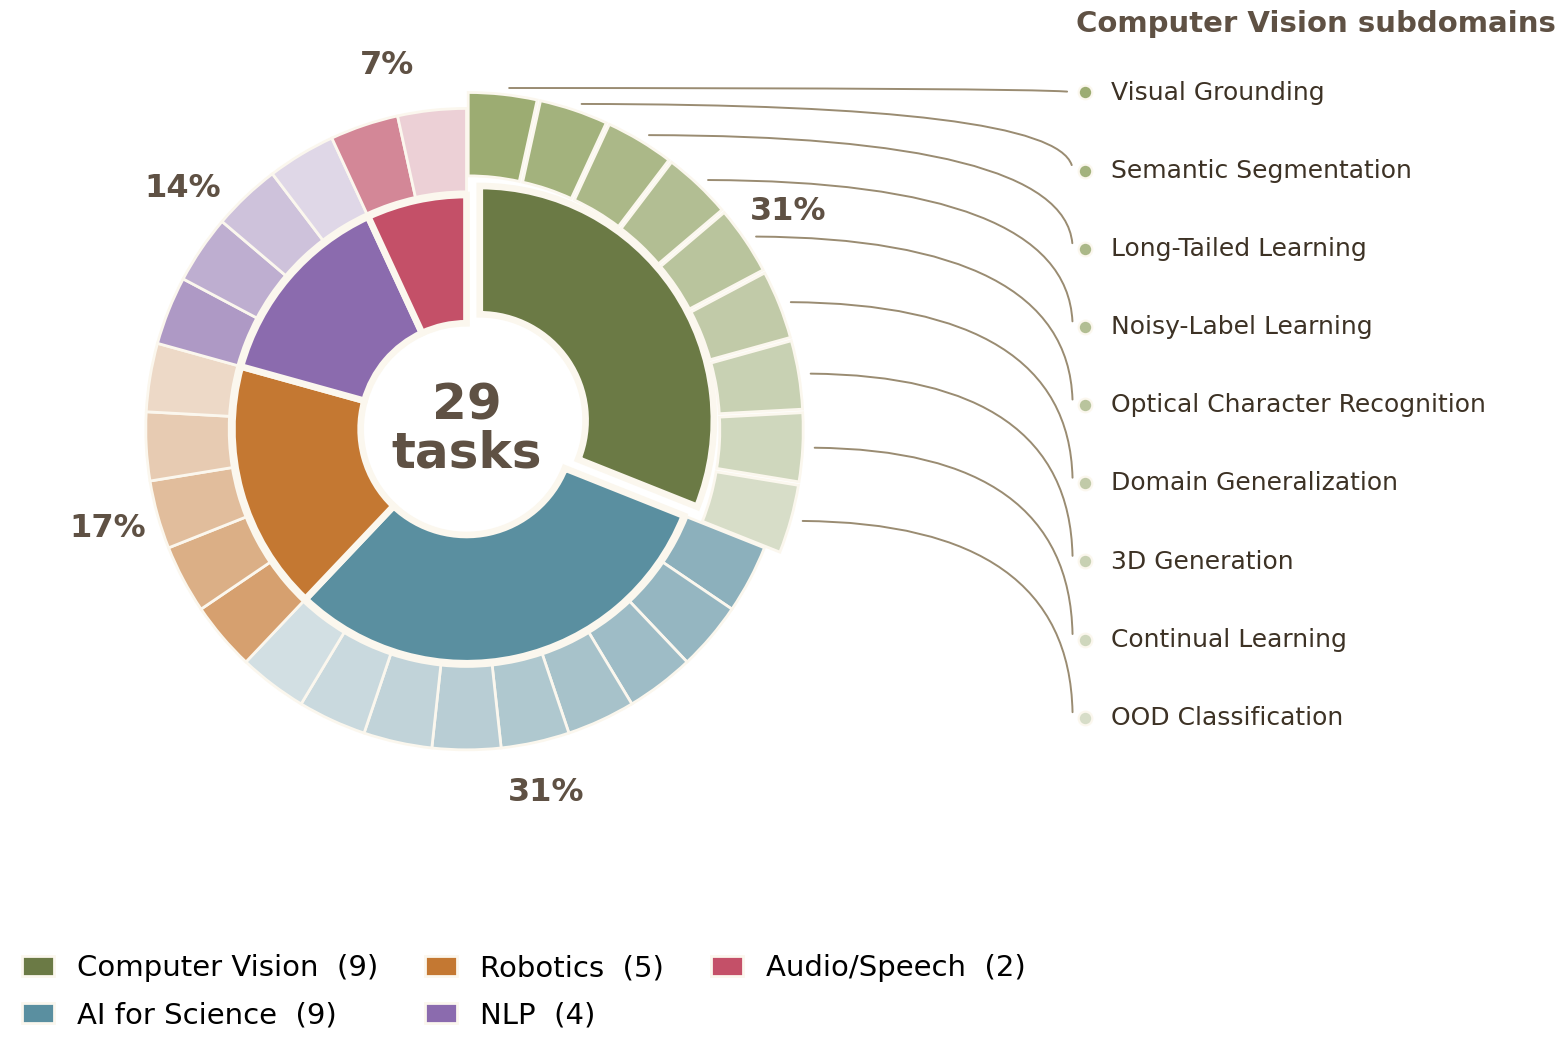
29 real-world ML tasks across five research domains. Each task ships with a description, a primary metric, a compute budget, and an automated evaluator.
Headline takeaways from agent–task episodes across frontier models.
Current frontier agents are useful research assistants — not yet reliable autonomous researchers.
-
01
Top agent reaches only / 100.
Even the strongest agent () leaves points still to be earned — far from doing research on its own.
-
02
Running the loop is easy; improving within it is hard.
8 of 11 agents reliably read the task, write code, run experiments, and read the results. The gap appears after that: even the strongest agent recovers less than a quarter of the remaining room to improve after its first valid result.
-
03
Most agents barely improve after their first try.
Across 301 valid agent–task attempts, the median improvement from first to best is only 3 percentage points of normalized achievement. 30% don't improve at all; 69% improve by less than 10 percentage points. The problem isn't that agents never see whether an idea worked — they fail to convert that signal into a better next decision.
-
04
More iterations don't help.
Whether an episode ends from the agent's own done signal, the 30-iteration cap, or wall-clock exhaustion, average improvement plateaus at the same ceiling. More tries alone don't unlock better research — high-gain iteration isn't yet the default behavior.
-
05
Agents keep tweaking the same thing.
In ~30% of episodes, when a result is poor the agent keeps editing the same layer of the solution — the hypothesis, the data pipeline, the modeling assumption, or the evaluation contract — instead of revising it. Productive trajectories are hypothesis-driven; the rest are continuation-driven. The paper calls this wrong-layer fixation.
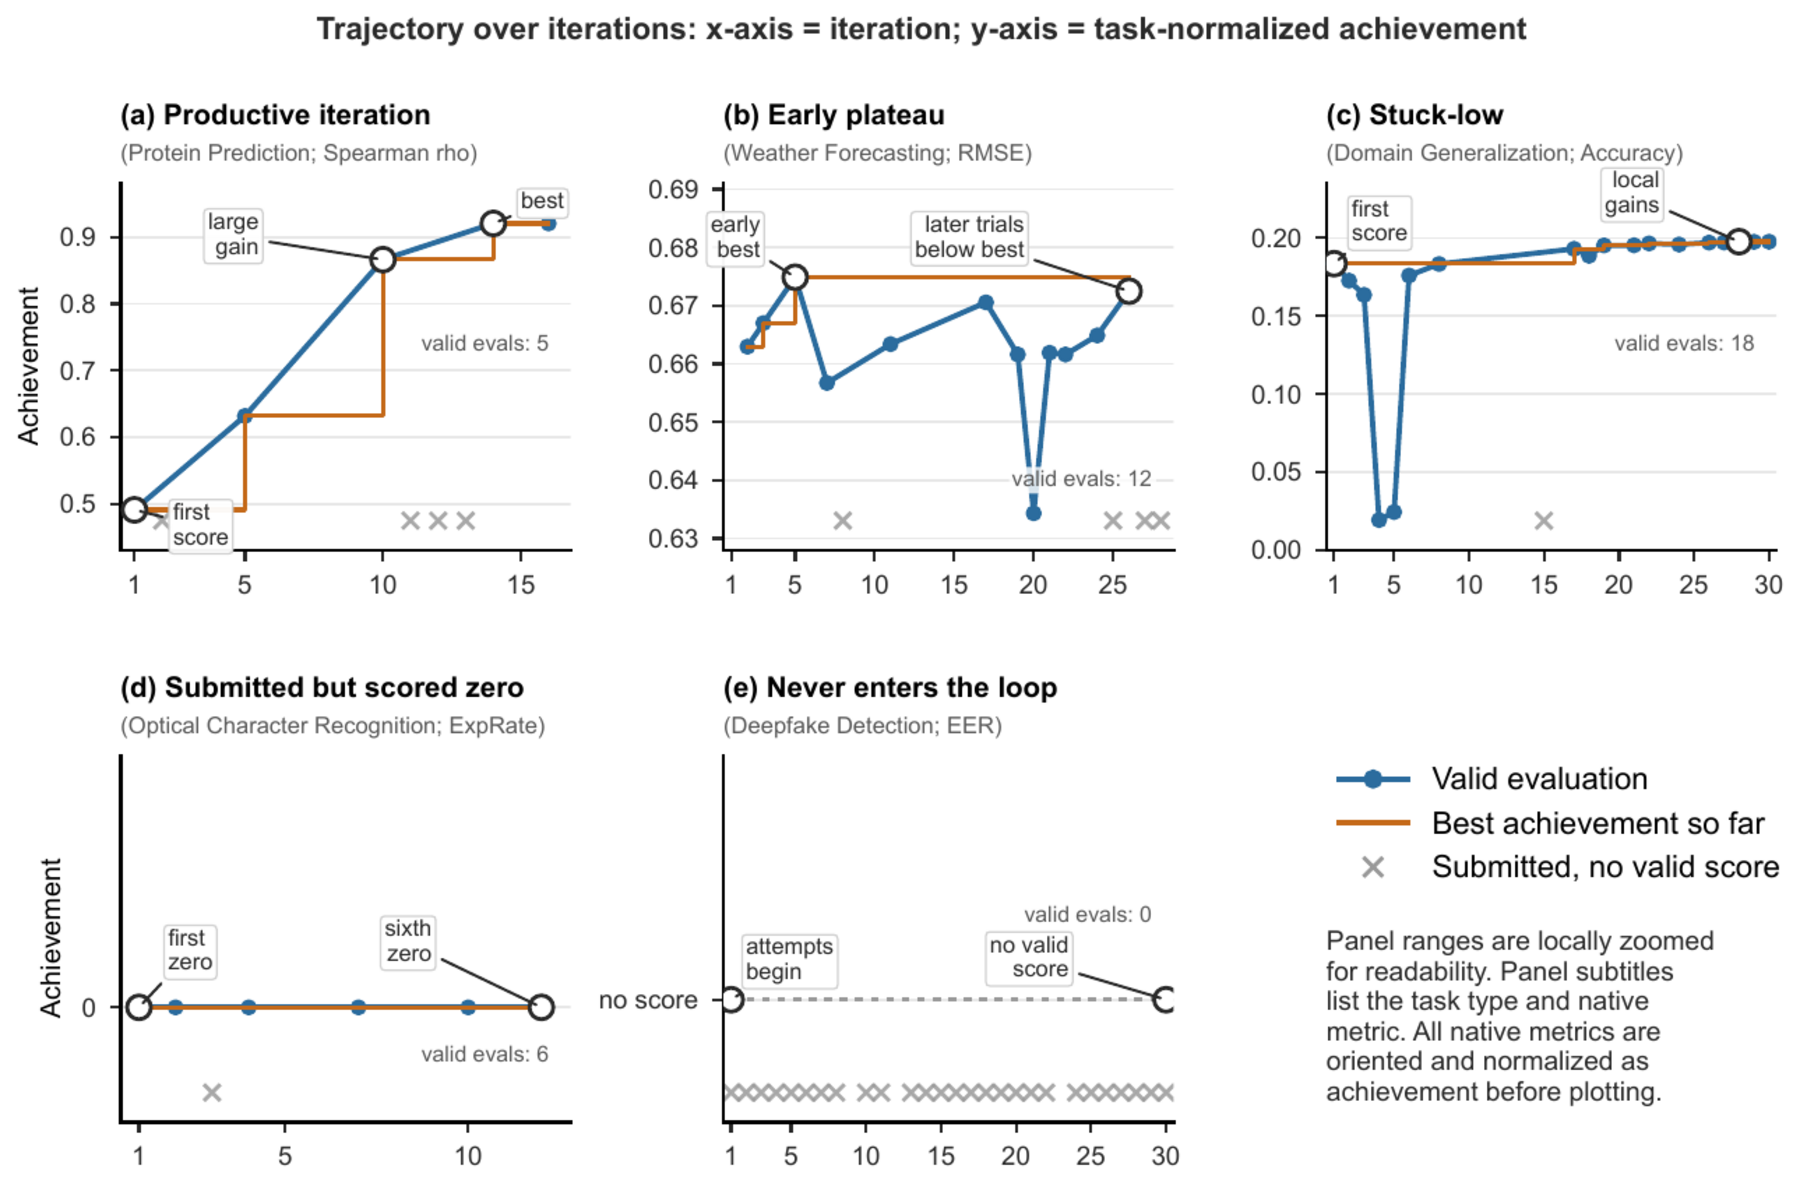
Paper in preparation (2026). The BibTeX entry will be updated on release.
| # | Model |
Final Score
mean(domain)
|
|
|---|---|---|---|
| — — |
| # | Model |
|
|---|---|---|
|
|
— — |
Metric Definitions
Definitions for the leaderboard agent scores above and for the capability diagnostics used in the analysis below.
Definitions for the leaderboard agent scores above.
| Metric | Formula | Definition |
|---|---|---|
| Final Score | \( \displaystyle \mathrm{FARBenchScore}_a = \frac{1}{|D|}\sum_{d\in D}\mathrm{DomainScore}_{a,d} \) | Primary leaderboard ranking in the Domain Scores view; summarizes each agent across all five domains with equal domain weight. |
| Domain Score | \( \displaystyle \mathrm{DomainScore}_{a,d}=100\cdot\frac{1}{|T_d|}\sum_{t\in T_d} A_{a,t} \) | Average task-normalized achievement within domain \( d \). These values are shown as the per-domain columns in the Domain Scores view and show which research areas drive or limit the final score. |
| Task Score | \( \displaystyle \mathrm{TaskScore}_{a,t}=100\cdot A_{a,t} \) \( \displaystyle A_{a,t}=\operatorname{clip}\!\left(\frac{s_{a,t}-s^{\mathrm{floor}}_t}{s^{\mathrm{target}}_t-s^{\mathrm{floor}}_t},0,1\right) \) | Cells in the Task Scores view; compares agents on each task after metric orientation, floor/target normalization, and clipping. Valid-zero scores, no-score cells, and missing active model-task cells use \( A_{a,t}=0 \) in leaderboard aggregation, keeping active-task denominators fixed across agents. |
| Raw Metric | \( s^{\mathrm{raw}}_{a,t} \) | The evaluator's native primary metric before task normalization. Header arrows indicate whether higher or lower is better. This view exposes the original evaluator outputs before conversion into task-normalized achievement. |
| Metric | Formula | Definition |
|---|---|---|
| Instruction Following | \[ \mathrm{IF}_{a,t}= \begin{cases} 1-\tau^{\mathrm{first}}_{a,t}, & \text{if a valid evaluation exists}\\ 0, & \text{otherwise} \end{cases} \] \( \displaystyle \tau^{\mathrm{first}}_{a,t}=\max\!\left(\frac{i^{\mathrm{first}}_{a,t}}{I_t},\frac{e^{\mathrm{first}}_{a,t}}{H_t}\right) \) | Measures early valid evaluator feedback: whether the agent quickly produces a runnable, accepted artifact that can guide later iterations. A valid evaluation is an accepted evaluator run that returns the task's scorable primary metric. \( i^{\mathrm{first}} \) and \( e^{\mathrm{first}} \) are the iteration and elapsed time used at that first valid feedback; \( I_t \) and \( H_t \) are the task budgets. A smaller \( \tau^{\mathrm{first}} \) means the agent entered the empirical feedback loop earlier, so IF is higher. |
| Code Execution Success | \( \displaystyle \mathrm{CES}=\frac{N^{\mathrm{ok}}_{\mathrm{exec}}}{N^{\mathrm{run}}_{\mathrm{exec}}} \) | Measures command stability using recorded shell-command outputs. \( N^{\mathrm{run}}_{\mathrm{exec}} \) counts iterations with a command_output.json record; \( N^{\mathrm{ok}}_{\mathrm{exec}} \) counts those with exit code 0 and no timeout. Episodes with no recorded command output receive zero. |
| First Achievement | \( \displaystyle \mathrm{FA}=f_{a,t} \) | Measures the quality of the first valid scorable artifact. It separates agents that quickly produce a meaningful baseline from agents whose first runnable result is weak. |
| Headroom Gain | \( \displaystyle \mathrm{HG}=\operatorname{clip}_{[0,1]}\!\left(\frac{b_{a,t}-f_{a,t}}{\max(1-f_{a,t},\epsilon)}\right) \) | Measures how much of the remaining room to improve is recovered after the first valid result. It rewards adaptation to feedback rather than merely starting from a low baseline. |
| Progress Efficiency | \( \displaystyle \mathrm{PE}=\int_0^1 M_{a,t}(\tau)\,d\tau \) | Measures the left-continuous area under the best-so-far clipped achievement curve over normalized budget. High PE means the agent reaches good results early and maintains them through the episode. |
| Pass at 0.5 | \( \displaystyle \mathrm{Pass@0.5}=\mathbb{I}[b_{a,t}\ge 0.5] \) | Measures whether the episode reaches at least half of the task-normalized target gap. After aggregation, it reflects breadth of competent cross-task performance. |
Analysis
Detailed capability and iteration analysis for the trajectory-level agent capability diagnostics.
Capability Diagnostics
Iteration Analysis
Five recurring regimes
Across 319 agent-task episodes, these regimes summarize how agents respond to empirical feedback: productive iteration, early plateau, stuck-low, submitted-but-scored-zero, and never-enters-loop.
Experiments
| Task | Agent | Best Metric | Iters | Time | Evals | In Tokens | Out Tokens | Compute | Status |
|---|---|---|---|---|---|---|---|---|---|
Iteration